Can Live OBD2 Data Diagnose Transmission Problems?
Quick Answer
Yes, live OBD2 data can help diagnose many transmission problems, but it rarely gives a single yes-or-no verdict. It works best when it shows a mismatch: the commanded gear versus the gear actually achieved, a speed ratio that does not fit that gear, torque-converter slip that stays high after lockup is commanded, or fluid temperature outside its normal range. Basic generic scanners may show only part of this picture.
Transmission trouble rarely arrives as one clean clue. A harsh shift, a flare between gears, or a feeling of slipping can each have several causes. Live data turns that feeling into numbers you can compare while the fault happens: what was commanded, what the sensors reported, and how the transmission responded.
What Live Transmission Data Can Actually Show
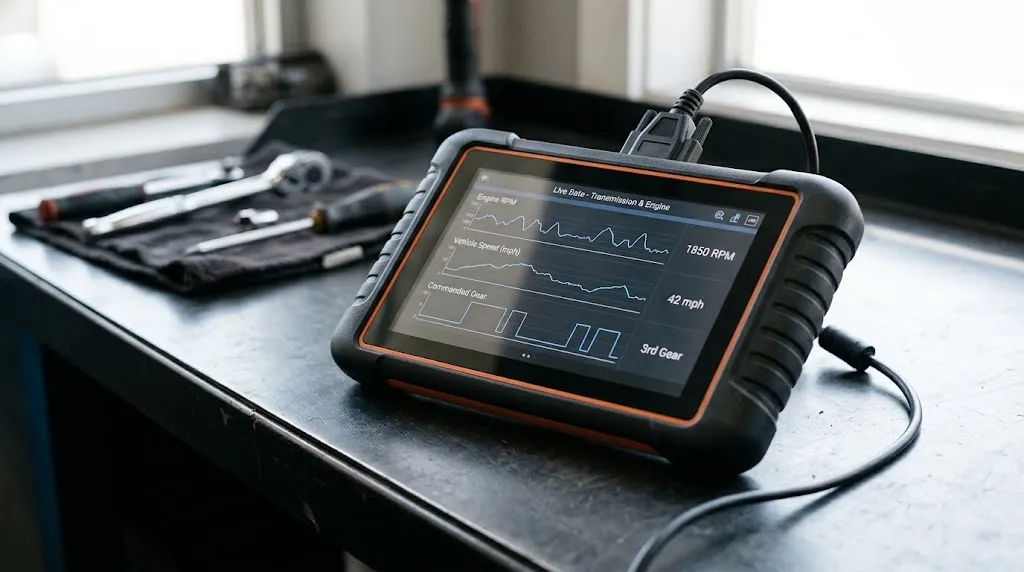
The useful live stream is not temperature alone. It is the relationship between several values at the same moment: engine speed, vehicle speed, throttle position, commanded gear, input and output shaft speeds, solenoid commands, lockup status, and fluid temperature where available.
A fault usually breaks one of those relationships. If the computer commands third gear but the speed ratio still looks like second gear, something failed to complete the shift, or a sensor is reporting it wrong. If engine speed rises sharply while vehicle speed does not, that pattern points toward slip, not just low engine power.
| Parameter | What it helps reveal | Pattern worth noting |
|---|---|---|
| Commanded vs. actual gear | Whether a requested shift happened | Command changes, but the ratio does not follow |
| Input and output speeds | The effective gear ratio in use | Ratio fits the wrong gear, or drifts during a shift |
| Torque-converter slip | Lockup clutch behaviour | High slip remains after lockup is commanded |
| Transmission fluid temperature | Heat, load, and cooling problems | Temperature climbs steadily under normal driving |
| Solenoid command and status | Whether the control side acted | Command is present, but the shift still does not occur |
Not every vehicle exposes every row through generic OBD2. Some values appear only in the transmission control module, or only with enhanced data. That gap is often the difference between a useful session and a frustrating one.
How to Read a Shift Problem From the Numbers
Start with the shift itself. Note the commanded gear, then watch input and output speeds. In a completed shift, their ratio should settle into the ratio expected for that gear. A brief transition is normal. A ratio that never settles, settles in the wrong gear, or changes again without a new command turns a vague complaint into a diagnostic lead.
Take a hypothetical example. Fourth gear is commanded at steady speed, but the ratio stays close to third gear, and engine speed stays higher than expected for that road speed. That does not name the failed part. It narrows the next question: did the shift fail mechanically or hydraulically, did a solenoid fail to act, or is a speed sensor misleading?
Throttle and load belong in the same view. A transmission may hold a lower gear longer or shift more firmly at high throttle and load, and that can be normal. The same delay at light throttle, on level ground, with normal engine data is far more informative. For a broader view, see what OBD2 live data can show.
Torque-Converter Slip and Lockup: A Strong Diagnostic Signal
The torque converter links engine and transmission through fluid until its lockup clutch engages. Once lockup is commanded at steady cruising speed, engine and input speeds should move close together, leaving only a small amount of slip. The acceptable amount varies by vehicle and condition, so one universal number would be misleading.
The pattern matters more than any single reading. If lockup is commanded and slip stays high, the clutch may not be engaging fully, or the command may not be reaching it. If slip rises and falls with a shudder, that timing links the symptom to converter behaviour. If lockup never commands, check temperature, speed, throttle, brake-switch input, or a stored fault blocking lockup.
What Transmission Fluid Temperature Can and Cannot Tell You
Transmission fluid temperature, often labelled TFT, is one of the most practical live values when available. Many guides describe everyday driving in roughly the 175–200°F (about 80–93°C) range, but that is a general guide, not a specification for every transmission. Towing, hills, traffic, and hot weather can push it higher. Check that model’s service information.
Trend and context matter most. A temperature that rises steadily in ordinary driving, stays high after load drops, or climbs with slipping and harsh shifts points toward a cooling, fluid, load, or efficiency problem. One high reading after towing up a long grade, with normal shifts and no warning, is a weaker clue alone.
TFT has a clear limit: it does not measure fluid level or condition. A transmission can be low on fluid, or have degraded fluid, while temperature still looks plausible. Temperature supports a diagnosis; it does not replace a level check where the design allows one.
Warning
Do not keep driving hard to “prove” a fault after sustained overheating, severe slipping, a burning smell, or a transmission warning. Reduce load and get it checked.
Why Generic OBD2 Often Shows Less Transmission Data Than Expected
Many drivers connect a basic scanner and find engine values but little transmission data. That is not always a scanner fault. Generic OBD2 was built mainly around emissions-related powertrain information, so its standard parameter list is limited. MOTOR’s explanation of generic OBD2 data notes that generic-mode data may be less complete than manufacturer-specific data.
Fluid temperature is a good example: on many vehicles it is manufacturer-specific, not a standard generic value, so a generic app may not offer it. Solenoid details, clutch adaptation values, and some ratio calculations may likewise live in enhanced data. If they are missing, do not guess from engine data alone. Check whether the scanner can enter the transmission module, or whether another tool or app profile supports that vehicle’s enhanced parameters.
“No transmission data” is not “no problem”; see why a scanner cannot access the transmission module and how to scan the transmission control module.
What Trouble Codes Add to Live Data
Live data shows behaviour; codes show what the control system already judged wrong. Transmission codes in the P07xx and P08xx ranges are especially useful. Incorrect-gear-ratio codes, such as the P0730 family, point to a ratio that does not match the commanded gear. Solenoid codes in the P075x range point to a specific solenoid circuit or performance issue. Torque-converter codes in the P074x range point to lockup control or performance, while P0218 points to an over-temperature event already recorded.
Use codes and live data together. A ratio code plus a live ratio stuck in the wrong gear strengthens the case for a real shift failure. A solenoid code plus a command present but no shift response helps separate a control problem from a mechanical one. A code with normal live data may be intermittent or pending, so timing matters. Freeze-frame data can help by capturing conditions when the fault was set, as explained in when OBD2 freeze-frame data is captured.
Do not clear codes before recording live data if the fault is intermittent. Clearing can erase the stored clue and reset learned behaviour, leaving a clean scan with the same fault waiting to return. Record codes, freeze-frame values, and the live pattern first.
A Practical Live-Data Check Sequence
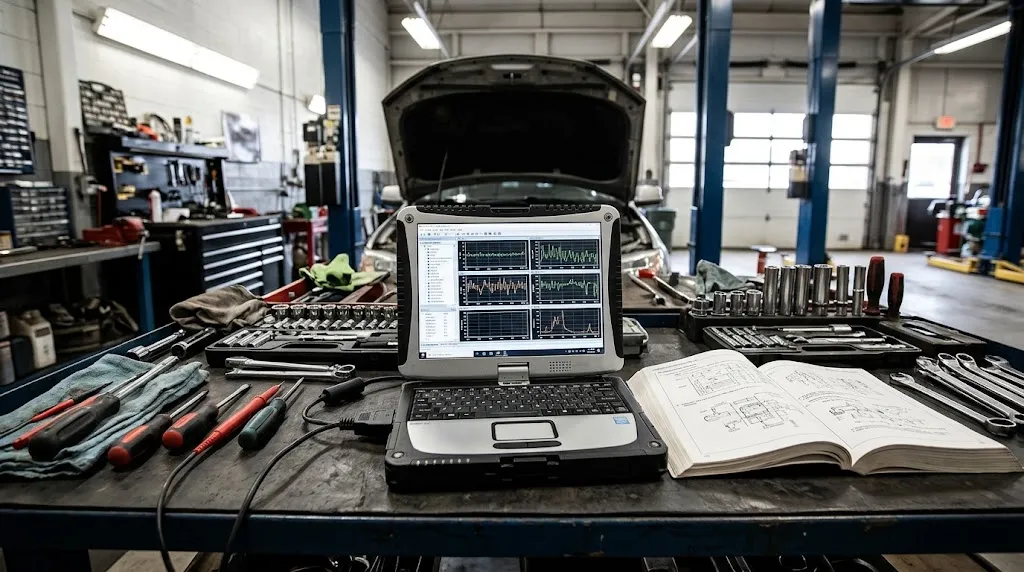
A useful session does not need dozens of parameters at once. Too many values slow refresh and hide patterns. Choose a small set that matches the complaint, then compare it before, during, and after the symptom.
- Parked, record stored and pending codes, fluid temperature, commanded gear, and any warning state.
- Select a focused set: commanded gear, input and output speeds, engine speed, vehicle speed, throttle position, lockup status or slip, and fluid temperature.
- Graph key values when possible. A graph makes a delayed shift, ratio change, or slip spike easier to spot than a flickering number.
- Drive normally first, then reproduce the complaint only where safe and legal. Note what changed just before the symptom appeared.
- Compare the faulty moment with a normal shift at similar speed, throttle, and temperature. That difference is usually the diagnosis.
What Live Data Cannot Prove on Its Own
Live data shows commands and sensor responses. It does not directly show clutch-pack thickness, seal condition, valve-body wear, or fluid quality. A solenoid can be commanded correctly while a valve sticks, and a pressure problem can hide behind a normal-looking command. In those cases, live data narrows the area but cannot finish the job without further checks, such as a manufacturer procedure, a pressure test where applicable, or internal inspection.
Continuously variable and dual-clutch transmissions add caution. Their ratio changes and clutch-control values do not map neatly onto conventional automatic gear logic. A reading that looks wrong for a stepped automatic may be normal for a CVT, and adaptation values may matter more than a simple gear number.
Live data can also mislead when a sensor is wrong. A faulty input-speed, output-speed, temperature, or throttle sensor can make a healthy transmission look faulty, or mask a real fault. When numbers contradict the physical symptom, verify the sensor input before condemning the transmission. Background on this is in how accurate OBD2 live data is.
Related Product
OBD2 Scanner With Transmission Live Data
A scanner that shows transmission live data, not engine data only, lets you compare commanded gear, slip, and fluid temperature during a real shift.
As an Amazon Associate, we earn from qualifying purchases.
Frequently Asked Questions
Can a basic OBD2 scanner diagnose transmission problems?
Sometimes, but only partly. It can usually read powertrain codes and engine live data, and may show some transmission codes. It often cannot show manufacturer-specific values such as fluid temperature, detailed solenoid data, or clutch adaptation values, so deeper diagnosis may need enhanced access.
What is the most useful live value for a slipping transmission?
Commanded gear plus the input-to-output speed ratio, together with engine and vehicle speed. If the ratio does not match the commanded gear, or engine speed rises without vehicle speed following, that pattern supports slip more than any single value.
Does live data show transmission fluid level?
No. It can show fluid temperature where a sensor is available, but not level or condition. Level and condition still need the vehicle’s specified checking procedure, where provided, or a physical inspection by a suitably equipped workshop.
Why does my scanner show engine data but no transmission data?
It may be limited to generic OBD2 mode, the vehicle may expose transmission data only through its transmission control module, or the app profile may not support that model’s enhanced parameters. Try the transmission-module menu, a vehicle-specific profile, or a scanner with enhanced support.
Can live data tell whether a transmission needs replacing?
No, not on its own. It can show failing shifts, persistent slip, or repeated overheating, but it cannot directly measure internal wear or prove replacement is the only repair. That decision normally needs further testing and professional inspection.
Should I clear transmission codes before checking live data?
Usually not. Record codes, freeze-frame data, and the live pattern first, because clearing can remove the stored clue and change learned behaviour. Clearing is more useful after a repair, to check whether the fault returns under the same conditions.
Conclusion
Live OBD2 data helps most as a first investigation: it shows whether commands, speeds, ratios, slip, and temperature behave together as they should. Use a focused parameter set, compare faulty moments with normal ones, and check codes and freeze-frame data before clearing anything. When the pattern shows persistent slip, a failed shift, or repeated overheating, move to the specific tests that can confirm the cause.

I’m Alex Rahman, a car enthusiast and automotive writer focused on practical solutions, car tools, and real-world driving advice. I share simple and honest content to help everyday drivers make better decisions.
