What Can OBD2 Live Data Show? Real-Time Vehicle Diagnostics
Quick Answer
OBD2 live data shows real-time measurements from your vehicle’s sensors and computer control modules while the engine is running. It tracks parameters like engine RPM, coolant temperature, fuel trim percentages, oxygen sensor voltages, and battery charging status, allowing you to spot developing mechanical and electrical issues before a warning light triggers.
When a check engine light illuminates, a standard code reader reveals the stored diagnostic trouble code (DTC) pointing to a broad problem area. However, that static code only tells you what failed after the fact—it does not show you the environmental conditions or exact sensor behaviors happening under the hood when the fault occurred.
Accessing live data streams through an OBD2 scanner bridges that gap. Instead of guessing why a component failed, you can watch live sensor metrics fluctuate second-by-second while driving or idling.
Core Engine Performance Parameters
The primary group of data streams available on almost all OBD2-compliant vehicles involves core engine operating metrics. These values establish the baseline mechanics of how air, fuel, and spark interact inside the cylinders.
Engine RPM and Vehicle Speed
Engine revolutions per minute (RPM) and vehicle speed track mechanical movement. Monitoring live RPM helps diagnose erratic idling, sluggish throttle responses, or torque converter slippage in automatic transmissions by comparing engine speed directly against wheel speed.
Mass Air Flow (MAF) and Manifold Absolute Pressure (MAP)
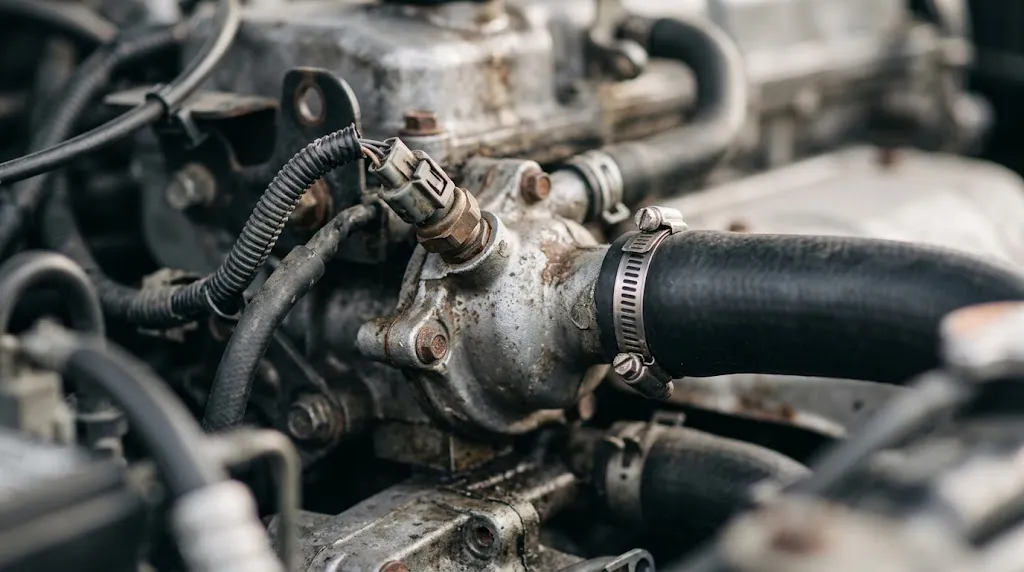
The MAF sensor measures the exact volume and density of air entering the intake, while the MAP sensor tracks intake manifold pressure. Live monitoring shows whether airflow numbers scale correctly as you accelerate. A sluggish or dirty MAF sensor will show low air mass readings at high RPMs, causing hesitation or poor acceleration.
Throttle Position Sensor (TPS)
The TPS indicates the exact physical angle of the throttle plate. Viewing this live ensures that the computer receives a linear voltage change as you press the accelerator pedal, helping isolate dead spots or lag in drive-by-wire throttle systems.
Fuel System and Combustion Efficiency Metrics
Combustion health depends heavily on precise air-fuel ratios. Live data gives technicians and DIYers a direct window into how the engine computer alters fuel delivery to maintain efficiency.
Short-Term and Long-Term Fuel Trim
Fuel trim data shows how much the engine computer is adjusting injector pulse widths away from baseline programming. Short-term fuel trim fluctuates rapidly to maintain balance, while long-term fuel trim records broader systemic adjustments.
Persistent positive fuel trim numbers indicate the computer is adding extra fuel to compensate for unmetered air—such as a vacuum leak or a failing fuel pump. Persistent negative numbers mean the system is cutting fuel to counter a rich condition, which can stem from leaking fuel injectors or a saturated EVAP canister purge valve.
Oxygen Sensor Readings
Upstream oxygen ($O_2$) or air-fuel ratio sensors track unburned oxygen in the exhaust stream before it reaches the catalytic converter. Live voltage readings should oscillate rapidly between lean and rich states during closed-loop operation. A sluggish or flatlined sensor signal points to a lazy oxygen sensor or an underlying combustion issue.
Key Insight
Downstream oxygen sensors monitor the efficiency of the catalytic converter itself. While upstream sensor voltages fluctuate constantly, a healthy downstream sensor should display a relatively stable voltage line once the exhaust system reaches operating temperature.
Thermal Management and Electrical System Health
Beyond combustion, live data streams expose hidden thermal and electrical vulnerabilities that do not always trigger an immediate diagnostic trouble code.
Engine Coolant Temperature (ECT)
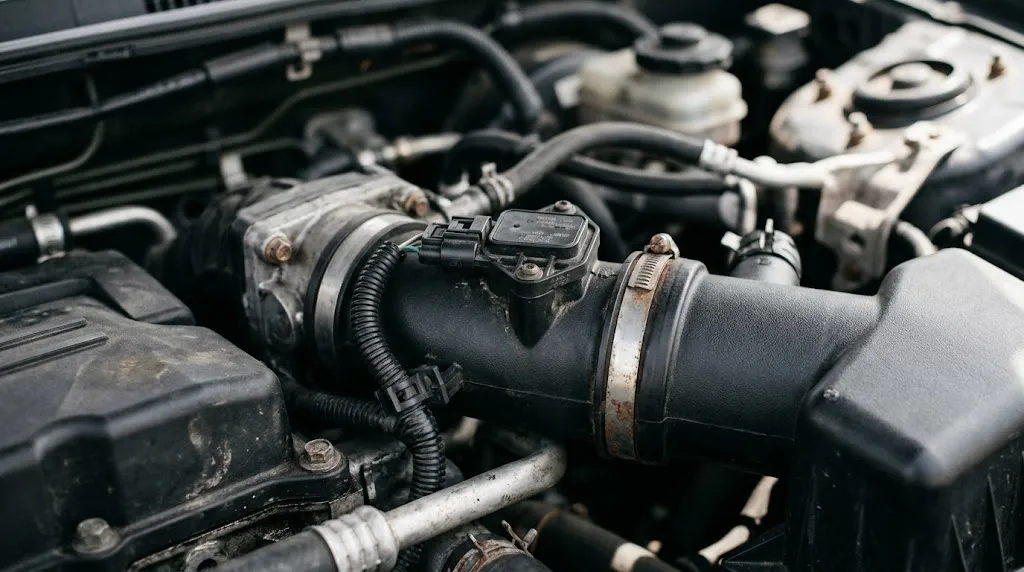
The ECT sensor tracks internal coolant warmth. Live monitoring reveals whether a thermostat is stuck open (causing the engine to warm up too slowly and hurt fuel economy) or stuck shut (risking rapid overheating). Normal operating temperatures generally sit between 190°F and 220°F (88°C to 104°C).
Battery Voltage and Alternator Output
Live voltage parameters show the electrical system state. With the engine off, a healthy battery rests around 12.6 volts. Once running, alternator output should elevate readings to between 13.7 and 14.7 volts. Watching this data while turning on high electrical loads (such as headlights, defrosters, and blower motors) exposes voltage drops caused by a failing alternator or corroded battery cables.
Advanced Diagnostic Parameters and Mode $06$
More capable OBD2 scanners pull specialized parameters beyond basic PID streams, including Mode $06$ data.
- Misfire Counters: Real-time cylinder misfire graphs track individual ignition or fuel delivery hiccups per cylinder before a strict misfire code (like P0300) registers.
- Variable Valve Timing (VVT): Commanded versus actual camshaft angle data shows whether oil control valves and timing phasers are responding accurately under load.
- EVAP System Pressure: Fuel tank pressure sensor metrics show whether the evaporative emission system holds pressure during self-tests.
Tip
When diagnosing an intermittent hesitation or stumble, record a live data log while driving. Reviewing the exported CSV file on a computer allows you to spot sudden spikes or dropouts in sensor voltage that are easy to miss while watching a small scanner screen on the highway.
Related Product
OBD2 Bluetooth Diagnostic Scanners
A wireless OBD2 adapter pairs with your smartphone to stream live sensor data, graph fuel trims, and monitor real-time engine health on the go.
As an Amazon Associate, we earn from qualifying purchases.
Frequently Asked Questions
Can I view OBD2 live data while driving the car?
Yes. Most modern handheld scan tools and smartphone-linked Bluetooth adapters allow you to view data streams while the vehicle is in motion. Having a passenger monitor the screen or recording a data log safely lets you evaluate sensors under actual load conditions.
Do all OBD2 scanners support live data streaming?
No. Basic entry-level code readers are designed strictly to read and clear generic diagnostic trouble codes (DTCs). To view live sensor metrics, your scan tool must explicitly support live data PIDs (Parameter IDs).
What is the difference between freeze frame data and live data?
Freeze frame data captures a single, static snapshot of sensor values exactly at the millisecond a fault code is triggered. Live data streams provide continuous, real-time updates of sensor values while the engine operates normally.
Why are some live data parameters missing on my car?
Vehicle manufacturers implement different subsets of the OBD2 standard. If a specific sensor or system—such as an oil temperature sensor or a turbocharger boost pressure gauge—is absent on your vehicle trim, the computer will not broadcast that specific data stream.
Can live data help me pass an emissions test?
Yes. Live data allows you to check the status of your readiness monitors and review oxygen sensor switching activity before you visit an emissions testing station, helping you confirm whether your emission control systems have completed their self-tests.
How do I know if my fuel trim numbers indicate a problem?
Normal fuel trim numbers hover close to zero percent. If your short-term or long-term fuel trims exceed positive or negative 10% consistently under normal driving conditions, it signals that the engine computer is fighting an unaddressed air leak, fuel delivery restriction, or sensor imbalance.
Conclusion
OBD2 live data transforms basic vehicle diagnostics from guesswork into a precise, evidence-based process. By monitoring real-time metrics such as fuel trims, coolant temperatures, sensor voltages, and engine load, you gain direct insight into how your vehicle’s mechanical and electrical systems perform under actual driving conditions. Utilizing these live parameters allows you to catch minor anomalies before they escalate into expensive component failures or unexpected roadside breakdowns.

I’m Alex Rahman, a car enthusiast and automotive writer focused on practical solutions, car tools, and real-world driving advice. I share simple and honest content to help everyday drivers make better decisions.
