What Is OBD2 Live Data? How to Read and Use the Parameters
Quick Answer
OBD2 live data is a real-time stream of sensor readings sent directly from a vehicle’s engine control module (ECM) to a diagnostic scan tool. By viewing live data while the engine is running, you can monitor exactly what the engine is doing second-by-second—such as fuel delivery, air intake, and engine temperature—to identify the root cause of a problem rather than just reading a static check engine light code.
Most people plug an OBD2 scanner into their car for one reason: to figure out why the check engine light is on. The scanner gives them a diagnostic trouble code (like P0171 for a lean condition), they replace a part based on that code, and often, the light comes right back on.
This happens because a trouble code only tells you what system noticed a problem. It does not tell you why the problem happened. A lean code simply means there is too much air and not enough fuel in the exhaust. It does not tell you if the cause is a vacuum leak, a dying fuel pump, or a dirty air sensor.
To bridge the gap between a generic engine code and an actual diagnosis, you need to look at what the engine’s sensors are seeing in real time. This is exactly what OBD2 live data provides. By learning how to read the continuous data stream coming from your engine computer, you can move away from guessing and start pinpointing failing parts, vacuum leaks, and electrical issues before you spend money on unnecessary repairs.
What Exactly Is OBD2 Live Data?
Modern vehicles are essentially computers on wheels. The Engine Control Module (ECM) or Powertrain Control Module (PCM) constantly receives electrical signals from dozens of sensors placed throughout the engine, exhaust, and fuel system.
The computer uses these sensor inputs to make split-second adjustments to the fuel injectors, spark plugs, and air valves to keep the vehicle running smoothly, efficiently, and cleanly. This continuous adjustment process is known as a closed-loop system.
OBD2 live data allows you to tap into this communication system. When you connect a capable scanner to the OBD2 port under your dashboard and select the “Live Data” or “Data Stream” function, the scanner asks the vehicle’s computer to broadcast its real-time sensor measurements to the screen.
The Environmental Protection Agency (EPA) and automotive engineers standardized this system in 1996, ensuring that any standardized scanner can request these data points across different vehicle makes and models. Each specific sensor reading or data point you can view is known as a Parameter Identification number, or PID.
Live Data vs. Trouble Codes vs. Freeze Frame
To understand how to troubleshoot effectively, it helps to understand how live data fits into the three main types of information your engine computer provides.
| Data Type | What It Does | Best Used For |
|---|---|---|
| Diagnostic Trouble Code (DTC) | A static alphanumeric code (e.g., P0301) triggered when a sensor reading falls outside normal limits. | Getting a general starting point for a diagnosis. |
| Freeze Frame Data | A single “snapshot” of the engine’s sensor readings at the exact millisecond a trouble code was triggered. | Seeing the specific conditions (like RPM and speed) that caused the check engine light to come on. |
| Live Data | A continuous, real-time feed of sensor measurements while the vehicle is currently running. | Watching how sensors react to throttle changes to find the actual failing component. |
Trouble codes point you toward the neighborhood of the problem. Live data lets you knock on the door and see exactly who is home.
How to Access and Read Live Data
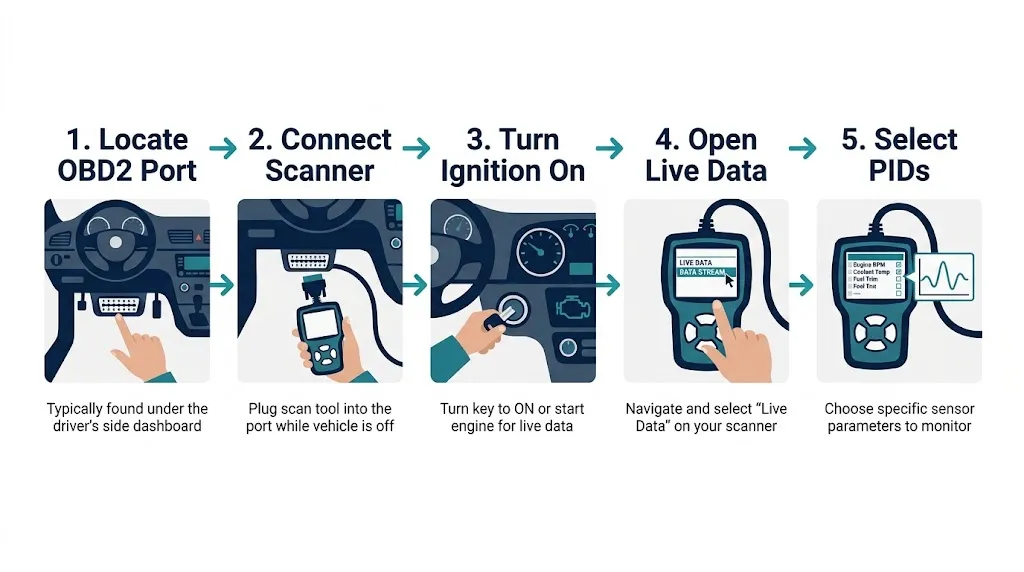
Not all scanners can read live data. Basic entry-level code readers usually only retrieve trouble codes and erase them. To read live data, you need a mid-range handheld scanner or a Bluetooth OBD2 adapter paired with a diagnostic smartphone app.
To start reading data, follow these steps:
- Locate the OBD2 Port: Find the 16-pin connector under the driver’s side dashboard, usually near the steering column or hood release.
- Connect the Scanner: Plug your device in firmly while the vehicle is off.
- Turn the Key On: Turn the ignition to the “On” position. For live data diagnostics, you will usually need the engine running (this state is known as Key On, Engine Running, or KOER).
- Navigate to the Data Stream: Select “Live Data,” “Datastream,” or “Real-Time Data” from your scanner’s main menu.
- Select Your PIDs: Depending on your scanner, you will see a massive list of acronyms. You can usually choose to view all data or select custom parameters to graph them on the screen.
Tip
If your scanner supports graphing, always graph the data rather than looking at raw numbers. Watching a line graph rise and fall makes it infinitely easier to spot a glitching sensor, a dead spot, or an erratic signal.
The Most Important Live Data Parameters to Monitor
When you open the live data menu, you might be overwhelmed by dozens of parameters. While every PID has a purpose, a vast majority of driveability issues and check engine lights can be diagnosed by understanding a few main categories.
Fuel Trims (STFT and LTFT)
Fuel trims are arguably the most powerful diagnostic tool in your live data arsenal. The engine computer constantly adjusts the amount of fuel being sprayed into the cylinders to maintain the perfect ratio of air-to-fuel (14.7 parts air to 1 part fuel).
- Short Term Fuel Trim (STFT): The computer’s immediate, split-second adjustments to fuel delivery based on real-time oxygen sensor feedback.
- Long Term Fuel Trim (LTFT): The learned behavior over time. If the STFT is constantly adding fuel, the LTFT will adopt that baseline so the STFT does not have to work as hard.
Fuel trim is measured as a percentage. Zero percent is perfect. The engine is using exactly the fuel it expected to use.
Positive numbers (+5%, +10%) mean the engine is running lean (too much air, not enough fuel). To prevent engine damage, the computer is actively adding fuel to compensate. Negative numbers (-5%, -10%) mean the engine is running rich (too much fuel, not enough air), so the computer is subtracting fuel.
Generally, fuel trims that combine (STFT + LTFT) to stay between -10% and +10% are considered normal. If the combined trims exceed +15% or -15%, the computer will trigger a check engine light.
Key Insight
You can diagnose a vacuum leak in seconds using fuel trims. If your fuel trim is highly positive (+18%) at idle but drops back to normal (+2%) when you rev the engine to 2500 RPM, you almost certainly have a vacuum leak. Unmetered air has a massive impact at idle but is choked out by the larger volume of air at higher RPMs.
Oxygen (O2) Sensor Voltage
Oxygen sensors measure how much unburned oxygen is in the exhaust gas, which is how the computer knows how to adjust the fuel trims. Vehicles typically have two types of O2 sensors per exhaust bank:
- Upstream O2 Sensor (Sensor 1): Located before the catalytic converter. This sensor dictates the air-fuel mixture.
- Downstream O2 Sensor (Sensor 2): Located after the catalytic converter. This sensor monitors converter efficiency.
When viewing live data for a standard zirconia upstream O2 sensor, the voltage should rapidly oscillate up and down between roughly 0.1 volts and 0.9 volts when the engine is warm and idling. This rapid switching means the computer is perfectly adjusting the air-fuel mixture back and forth across the ideal baseline.
The downstream O2 sensor has a completely different job. On the live data graph, a healthy downstream sensor will show a relatively flat, steady line around 0.45 volts. If the downstream sensor graph starts rapidly jumping up and down mirroring the upstream sensor, it means the catalytic converter is no longer storing oxygen and has likely failed.
Mass Air Flow (MAF) Sensor
The MAF sensor sits in the air intake and measures the physical volume and density of the air entering the engine. The computer uses this exact reading as the baseline to decide how much fuel to inject.
MAF is usually measured in grams per second (g/s) or pounds per minute (lb/min).
A good rule of thumb for engine idle: The MAF reading in grams per second should roughly match the engine displacement in liters. For example, a 2.0-liter engine at idle should read around 2.0 to 2.5 g/s. A larger 5.0-liter V8 should read closer to 5.0 g/s.
When you step on the gas pedal, the MAF graph should rise smoothly and sharply in direct proportion to the engine RPM. If the line graph is jerky, drops out momentarily, or is abnormally low, the MAF sensor is likely coated in carbon or failing.
Engine Coolant Temperature (ECT)
The ECT sensor tells the computer how hot the engine block is. This parameter is critical because the engine runs on entirely different logic depending on its temperature.
When you first start a cold car, the system is in “Open Loop.” The computer ignores the oxygen sensors and runs a pre-programmed rich fuel mixture to get the engine warmed up quickly. Once the ECT reaches roughly 140°F to 160°F (depending on the vehicle), the system enters “Closed Loop,” allowing the O2 sensors to take over precision fuel management.
If your ECT sensor is broken and falsely telling the computer that the engine is at -40°F, the computer will dump massive amounts of fuel into the engine, resulting in terrible fuel economy, black smoke, and engine stalling. Live data allows you to spot this immediately by verifying if the reported temperature matches reality.
How to Use Live Data for Basic Troubleshooting
Live data turns you from a parts-replacer into a diagnostician. Here is how you can use these data points together to solve common issues.
Scenario A: Diagnosing a Misfire (P0300, P0301-P0308)
If you have a cylinder misfire code, pull up the live data for “Misfire Counter” for each individual cylinder. You can physically watch which cylinder is accumulating misfires in real-time.
If Cylinder 3 is ticking upward, you can swap the ignition coil from Cylinder 3 to Cylinder 4. Watch the live data again. If the misfire counter on Cylinder 4 starts climbing, you have proven the ignition coil is dead without guessing. If the misfire stays on Cylinder 3, you know the coil is fine and you need to check the spark plug, fuel injector, or engine compression.
Scenario B: Sluggish Acceleration and Stalling
If the car bogs down when you accelerate, graph your Throttle Position Sensor (TPS) and your MAF sensor. With the key on and the engine off, slowly press the gas pedal to the floor.
The TPS graph should rise in a perfectly smooth diagonal line. If the line drops to zero halfway up, the sensor has a dead spot and needs to be replaced. If the TPS graph is smooth, start the engine and snap the throttle. If the MAF sensor graph is slow to rise or stumbles, the MAF is likely dirty and struggling to measure the incoming air.
Scenario C: Diagnosing a Bad Catalytic Converter (P0420)
A P0420 code means catalytic converter efficiency is below the threshold. Before spending hundreds of dollars on a new converter, look at your live data. Graph the Upstream O2 Sensor (Sensor 1) and Downstream O2 Sensor (Sensor 2) on the same screen while the engine is fully warmed up and idling.
If Sensor 1 is switching rapidly up and down, and Sensor 2 is copying that exact same rapid pattern, the catalytic converter is completely hollowed out or chemically dead. However, if Sensor 1 is stuck lean or rich, you do not have a bad converter; you have a fuel delivery problem that triggered a false converter code.
Warning
Never attempt to read live data on a handheld scanner or smartphone while driving the vehicle. If a diagnosis requires viewing data under engine load on the highway, have a passenger operate the scanner, or use a tool with a data-recording feature to review the graphs after you are safely parked.
Why Your Live Data Might Be Lagging
If you are watching your live data and the graphs look blocky, delayed, or the numbers are only updating once every two seconds, you are dealing with a refresh rate issue. Slow data can make it impossible to spot a momentary glitch in a sensor.
Live data speed is determined by the vehicle’s internal communication protocol and the processing power of the scanner. Older vehicles (pre-2008) often use older ISO or KWP protocols, which have inherently slow baud rates. Modern vehicles (2008 and newer) use the CAN bus (Controller Area Network) protocol, which is vastly faster and allows for smooth, near-instantaneous graphing.
If you are experiencing lag on a modern vehicle, try selecting fewer PIDs to monitor at once. Asking a scanner to process and display 40 different sensors simultaneously will severely slow down the refresh rate. Select only the 3 or 4 parameters strictly relevant to your specific problem to get the highest possible data resolution.
Related Product
OBD2 Diagnostic Scanner with Live Data Graphing
Upgrading to a scanner that supports fast-refresh graphing for multiple live data streams makes tracking down vacuum leaks, O2 sensor failures, and misfires significantly faster and more accurate.
As an Amazon Associate, we earn from qualifying purchases.
Frequently Asked Questions
Does every OBD2 scanner show live data?
No. Basic, entry-level code readers are only programmed to retrieve static diagnostic trouble codes and clear the check engine light. To view real-time sensor parameters, you must purchase a scanner or Bluetooth adapter specifically advertised as having “live data” or “data stream” capabilities.
Can I view live data while driving?
Yes, the vehicle’s computer broadcasts live data continuously whether the car is idling or driving at highway speeds. However, for safety reasons, you should never look at a scanner while driving. You must either have a passenger monitor the data or use a scanner that can record the data stream for later review.
What is a PID in OBD2 data?
PID stands for Parameter Identification. It is the standardized code that a scanner sends to the vehicle’s computer to request a specific piece of information. For example, the PID for Engine Coolant Temperature is standard across all vehicles, allowing any compatible scanner to request and display that specific temperature reading.
How is live data different from freeze frame data?
Live data is a continuous, actively updating feed of what the engine is doing right now. Freeze frame data is a single, static snapshot of the live data taken at the exact millisecond the vehicle’s computer detected a fault and triggered a check engine light.
Why is the live data on my scanner delayed or lagging?
Lag occurs when the scanner is trying to process too much information at once, or when the vehicle uses an older, slower communication protocol. To improve the refresh rate and get smoother graphs, deselect unnecessary data points and monitor only the three or four parameters related to your diagnostic problem.
Will live data tell me exactly which part is broken?
Live data does not explicitly say “replace the fuel pump,” but it provides the raw evidence you need to prove a part has failed. By watching how sensor voltages and percentages react to changes in engine speed, you can deduce exactly which component is no longer doing its job.
Conclusion
OBD2 live data is the bridge between knowing that your engine has a problem and understanding exactly how to fix it. While diagnostic trouble codes are a helpful starting point, they are easily misinterpreted, leading to unnecessary and expensive part replacements. By monitoring live data parameters like short term fuel trim, oxygen sensor voltage, and mass air flow, you can watch the engine’s internal logic work in real-time. Whether you are hunting down a frustrating vacuum leak or verifying a misfiring ignition coil, graphing the live data ensures your diagnostic decisions are based on hard, real-time evidence rather than guesswork.

I’m Alex Rahman, a car enthusiast and automotive writer focused on practical solutions, car tools, and real-world driving advice. I share simple and honest content to help everyday drivers make better decisions.
